Lokstadt Move
How Lokstadt moves
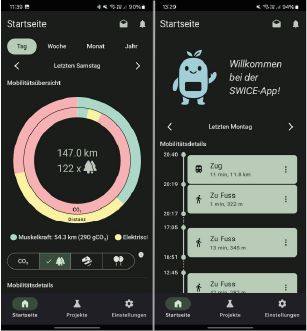
On May 25, 2025, the mobility campaign in Lokstadt started. In this project, we wanted to find out how Lokstadt residents get around, which modes of transport they use most frequently, and whether an app that visualizes their own mobility behavior can help them choose more sustainable modes of transport more often. For this purpose, the distances covered, including modes of transport, were recorded in the SWICE App, and the respective CO2 consumption was displayed. A total of 37 people participated in the project, 22 of them for the entire duration.
Modes of Transport
The participants’ mobility is already very sustainable overall. Most frequently, they traveled on foot (around 36% of journeys), followed by train (17%) and bicycle (13%). Even for longer distances of 3 kilometers or more, the train remained the most important mode of transport (42%). Cars were used more often (24%), while a small portion continued to use bicycles (7%). The result shows: In the city, participants rarely rely on cars and instead benefit from the good accessibility in the neighborhood. Only for longer distances does the car become a real alternative.
CO2 consumption
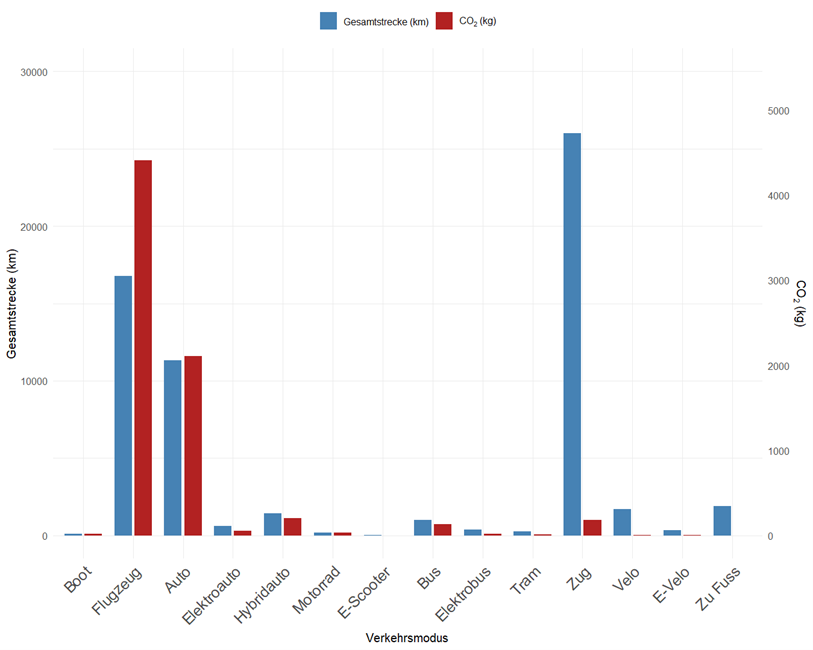
Looking at the total distances covered, it is clear that walking, bus, or bicycle journeys play hardly any role in the total CO2consumption. Lokstadt residents covered the largest part of their kilometers by train, plane, and car (see graphic). The difference becomes particularly clear when comparing the distances with the respective CO2emissions: While 8 airplane trips (approx. 16,700 km) caused over 4,400 kg of CO2 , the emissions from 843 train trips (approx. 26,000 km) totaled only around 180 kg of CO2. The figures thus show: Even small changes in long journeys (for example, fewer flights or car trips) make a big difference in CO2emissions.
Use of the mobility app
It gets exciting when you look at how the choice of means of transport has changed since the introduction of theCO2 consumption display in the app. Since June 15, the CO₂ consumption per route has been calculated and explained with clear comparisons in the app.
In the initial phase without CO₂ visualization, car journeys still accounted for around 20% of all kilometers traveled. After the visualization was introduced, this proportion fell to 13%. Train use also fell slightly – from 69% to 67%. In contrast, the proportion of kilometers covered by bike, e-vehicles and bus increased significantly. A positive trend can therefore be observed for the mobility campaign. However, as the study period was very short, only a longer observation period will show whether this remains the case in the long term.
Main Traffic Routes
Heatmaps were used to show which traffic routes are most heavily used. Yellow, orange, and red colors indicate routes with very high traffic volumes, while blue routes are actively used.

Main walking routes.

Main cycling routes.
The project report can be downloaded here.
Workshops with residents & stakeholders
The kick-off with the Lokstadt stakeholders took place in December 2022. On the one hand, the workshop served to get to know each other and identify roles. On the other hand, initial ideas for interventions in Lokstadt were collected.
 In January 2023, workshops were organized with the residents of Lokstadt on two evenings. The workshops served to identify the needs of the residents and the areas in which they see potential for more sustainable lifestyles. Together with the residents, we analyzed problems in a total of five areas and developed possible solutions. A total of 16 exciting ideas emerged from the workshops with stakeholders and residents. In particular, it emerged that there is a desire for better offers and opportunities for using bicycles and that there is a great desire for more interaction between residents. This could be in the form of swapping/loaning items or joint activities, events and meeting spaces.

Subsequently, the intervention ideas from the workshops were evaluated by the ZHAW researchers based on the following criteria: prioritization by residents, effectiveness regarding energy or CO2 reduction, support for sustainable lifestyles, relevance for research, and feasibility in Lokstadt. The last criterion, feasibility, was assessed together with the stakeholders.